Reference
If you use the results of the CS23D2.0 server in a publication, please cite the following paper:
Wishart DS, Arndt D, Berjanskii M, Tang P, Zhou J, Lin G.
CS23D: a web server for rapid protein structure generation using NMR chemical shifts and
sequence data. Nucleic Acids Res. 2008 Jul 1;36(Web Server issue):W496-502.
Tables
Table 1: RMSDs of distorted X-ray structures before and after chemical shift
refinement. The high quality X-ray structures of 9 proteins, for which complete
chemical shifts were also available, were distorted by randomly varying all phi and psi
angles uniformly within ±5°. The distorted structures were then
minimized using chemical shift refinement with GAFolder for 300 iterations.
Corrected chemical shifts from
RefDB were used.
Table 2: Results of modeling and refining 9 structures and comparison with native X-ray and
NMR structures. Native structures were excluded from CS23D2.02.0 databases during model generation.
Refinement for each model involved 10 runs of 300 iterations each, and selection
of the model with the lowest energy.
# Rama violations - indicates the number of residues that fall in the generously allowed and
disallowed regions of the Ramachandran plot as adapted from Lovell SC, et al. Structure
validation by Calpha geometry: phi,psi and Cbeta deviation. Proteins
2003 Feb 15;50(3):437-50. The fewer violations, the better the structure. Ideally there should
be no violations.
# Omega violations - indicates the number of residues that have Omega angles that are not in
the range 180.0 ± 12.5 degrees or 0.0 ± 15.0 degrees. Ideal Omega angles for
trans peptide bonds are 180 degrees while Ideal Omega angles for cis peptide bonds are 0
degrees.
Mean chemical shift correlation - indicates the Pearson correlation coefficient calculated
between input chemical shifts and those calculated by SHIFTX for the structure generated by
CS23D2.0. Values closer to 0.9 are optimal. Values less than 0.7 indicate possible problems
with the structure.
HCount (%) - indicates the percentage of residues in the protein that
are involved in canonical hydrogen bonds. Good structures have higher percentages of "good"
or canonical hydrogen bonds. Values approaching 80% are ideal. To ensure consistency, hydrogen
atoms for all structures were replaced by those from
Reduce
v3.10 (Word, et al.(1999) "Asparagine
and glutamine: using hydrogen atom contacts in the choice of sidechain amide orientation"
J. Mol. Biol. 285, 1733-1745).
Average H-bond energy - indicates the average H-bond energy calculated in kcal/mol (using
the DSSP definitions of Kabsch W, Sander C. Dictionary of protein secondary structure:
pattern recognition of hydrogen-bonded and geometrical features. Biopolymers.
1983 Dec;22(12):2577-637). Average H-bond energy indicates how close H-bonds are to ideal
geometry. The lower the average H-bond energy, the better the structure is.
| Protein Name |
PDB ID |
# Rama violations |
# Omega violations |
Mean chemical shift correlation |
HCount (%) |
Average H-bond energy (kcal/mol) |
| Barnase (X-ray) |
1A2P |
0 |
7 |
0.83 |
68% |
-1.68 |
| Barnase (NMR) |
1FW7 |
1 |
27 |
0.77 |
62% |
-1.45 |
| Barnase (CS23D2.0) |
|
0 |
13 |
0.77 |
65% |
-1.62 |
|
|
|
|
|
|
|
| CI-2 (X-ray) |
2CI2 |
1 |
0 |
0.77 |
71% |
-1.88 |
| CI-2 (NMR) |
3CI2 |
4 |
0 |
0.64 |
56% |
-1.75 |
| CI-2 (CS23D2.0) |
|
1 |
1 |
0.69 |
70% |
-1.50 |
|
|
|
|
|
|
|
| Ubiquitin (X-ray) |
1UBQ |
0 |
0 |
0.84 |
83% |
-1.83 |
| Ubiquitin (NMR) |
1XQQ |
4 |
21 |
0.77 |
75% |
-1.82 |
| Ubiquitin (CS23D2.0) |
|
0 |
4 |
0.77 |
79% |
-1.95 |
|
|
|
|
|
|
|
| DNAB Helicase (X-ray) |
1B79 |
1 |
0 |
0.66 |
84% |
-1.19 |
| DNAB Helicase (NMR) |
1JWE |
0 |
18 |
0.67 |
83% |
-1.33 |
| DNAB Helicase (CS23D2.0) |
|
0 |
7 |
0.67 |
83% |
-1.36 |
|
|
|
|
|
|
|
| Interleukin-4 (X-ray) |
1RCB |
4 |
1 |
0.67 |
78% |
-1.18 |
| Interleukin-4 (NMR) |
1BCN |
3 |
0 |
0.54 |
66% |
-0.91 |
| Interleukin-4 (CS23D2.0) |
|
1 |
1 |
0.54 |
70% |
-0.97 |
|
|
|
|
|
|
|
| BPTI (X-ray) |
6PTI |
1 |
0 |
0.79 |
65% |
-1.80 |
| BPTI (NMR) |
1OA5 |
4 |
0 |
0.68 |
57% |
-1.74 |
| BPTI (CS23D2.0) |
|
1 |
0 |
0.70 |
64% |
-1.82 |
|
|
|
|
|
|
|
| Calbindin (X-ray) |
1IG5 |
1 |
0 |
0.79 |
81% |
-1.24 |
| Calbindin (NMR) |
1CLB |
4 |
9 |
0.74 |
75% |
-1.52 |
| Calbindin (CS23D2.0) |
|
0 |
4 |
0.74 |
80% |
-1.52 |
|
|
|
|
|
|
|
| Vts1:RNA Dimer (X-ray) |
2D3D |
0 |
3 |
0.77 |
88% |
-1.35 |
| Vts1:RNA Dimer (NMR) |
2FE9 |
1 |
0 |
0.66 |
84% |
-1.19 |
| Vts1:RNA Dimer (CS23D2.0) |
|
1 |
0 |
0.67 |
83% |
-1.26 |
|
|
|
|
|
|
|
| Ribosomal Protein L25 (X-ray) |
1DFU |
1 |
0 |
0.76 |
78% |
-1.73 |
| Ribosomal Protein L25 (NMR) |
1B75 |
9 |
5 |
0.56 |
61% |
-1.69 |
| Ribosomal Protein L25 (CS23D2.0) |
|
7 |
10 |
0.59 |
74% |
-1.73 |
Table 3. Performance of CS23D2.0 in generating 3D structures for 62 randomly selected BMRB files.
The given RMSDs are those of the final structure relative to the known (X-ray or NMR)
structure.
|
BMRB ID
|
Protein Name
|
RMSD (Å)
|
Runtime
(min)
|
Type
|
|
All atoms
|
C-alpha
|
|
BMR2208
|
Cyclophiliin
|
0.98
|
0.39
|
33
|
Fragment Assembly +
Homology Modeling
|
|
BMR4022
|
Carbonic Anhydrase
|
1.58
|
0.81
|
48
|
Fragment Assembly +
Homology Modeling
|
|
BMR4031
|
Ribonuclease A
|
1.69
|
0.40
|
9
|
Fragment Assembly +
Homology Modeling
|
|
BMR4035
|
Regulatory Protein E2
|
1.67
|
0.58
|
6
|
Fragment Assembly +
Homology Modeling
|
|
BMR4046
|
Drosophila Heat Shock Factor
|
3.21
|
2.02
|
8
|
Fragment Assembly +
Homology Modeling
|
|
BMR4047
|
HU Protein
|
2.24
|
0.84
|
7
|
Fragment Assembly +
Homology Modeling
|
|
BMR4053
|
Staphylococcal Nuclease
|
1.00
|
0.22
|
12
|
Fragment Assembly +
Homology Modeling
|
|
BMR4064
|
Collagenase
|
0.97
|
0.30
|
13
|
Fragment Assembly +
Homology Modeling
|
|
BMR4070
|
FimC
|
2.28
|
1.73
|
37
|
Fragment Assembly +
Homology Modeling
|
|
BMR4072
|
RNA-1 Mod Protein
|
3.99
|
3.13
|
4
|
Fragment Assembly +
Homology Modeling
|
|
BMR4076
|
Outer Surface Protein
|
2.21
|
2.04
|
19
|
Fragment Assembly +
Homology Modeling
|
|
BMR4077
|
FK506 Binding Protein
|
0.93
|
0.41
|
7
|
Fragment Assembly +
Homology Modeling
|
|
BMR4081
|
Interferon Alpha
|
1.14
|
0.38
|
9
|
Fragment Assembly +
Homology Modeling
|
|
BMR4082
|
Profilin
|
0.99
|
0.51
|
9
|
Fragment Assembly +
Homology Modeling
|
|
BMR4083
|
CheY
|
1.18
|
0.47
|
8
|
Fragment Assembly +
Homology Modeling
|
|
BMR4084
|
HnRNP
|
0.77
|
0.10
|
15
|
Fragment Assembly +
Homology Modeling
|
|
BMR4090
|
Basic FGF
|
3.34
|
1.75
|
6
|
Fragment Assembly +
Homology Modeling
|
|
BMR4091
|
Basic Fibroblast Growth Factor
|
1.64
|
0.41
|
12
|
Fragment Assembly +
Homology Modeling
|
|
BMR4092
|
Core Binding Factor
|
1.84
|
0.89
|
9
|
Fragment Assembly +
Homology Modeling
|
|
BMR4094
|
Interleukin 4
|
0.64
|
0.22
|
10
|
Fragment Assembly +
Homology Modeling
|
|
BMR4098
|
Fatty Acid Biniding Protein
|
3.39
|
1.96
|
10
|
Fragment Assembly +
Homology Modeling
|
|
BMR4116
|
Im9 Immunity Protein
|
0.81
|
0.23
|
6
|
Fragment Assembly +
Homology Modeling
|
|
BMR4117
|
Elongation Factor-1 Beta
|
2.18
|
1.35
|
7
|
Fragment Assembly +
Homology Modeling
|
|
BMR4132
|
Human UBC9
|
0.48
|
0.12
|
25
|
Fragment Assembly +
Homology Modeling
|
|
BMR4127
|
DNA-binding Domain of SV40 T Antigen
|
2.61
|
1.57
|
11
|
Fragment Assembly +
Homology Modeling
|
|
BMR4186
|
CRABPII
|
1.12
|
0.55
|
11
|
Fragment Assembly +
Homology Modeling
|
|
BMR4198
|
Syntaxin 1A, N-domain
|
3.48
|
2.66
|
9
|
Fragment Assembly +
Homology Modeling
|
|
BMR4285
|
Apo-S100A1
|
3.05
|
1.98
|
18
|
Fragment Assembly +
Homology Modeling
|
|
BMR4296
|
Cold Shock protein
|
1.49
|
0.57
|
6
|
Fragment Assembly +
Homology Modeling
|
|
BMR4297
|
DnaB (24-136)
|
1.96
|
0.88
|
9
|
Fragment Assembly +
Homology Modeling
|
|
BMR4307
|
Hamster Prion
|
3.22
|
1.67
|
19
|
Fragment Assembly +
Homology Modeling
|
|
BMR4326
|
DNA polymerase B
|
2.38
|
1.74
|
6
|
Fragment Assembly +
Homology Modeling
|
|
BMR4334
|
ARID Domain of Dead-Ringer Protein
|
3.26
|
2.53
|
10
|
Fragment Assembly +
Homology Modeling
|
|
BMR4340
|
Major Urinary Protein
|
0.75
|
0.33
|
14
|
Fragment Assembly +
Homology Modeling
|
|
BMR4354
|
Maltose Binding Protein
|
0.99
|
0.39
|
49
|
Fragment Assembly +
Homology Modeling
|
|
BMR4380
|
Epithelial Cadherin. N-domain
|
2.41
|
2.10
|
7
|
Fragment Assembly +
Homology Modeling
|
|
BMR4403
|
PyJ
|
2.96
|
1.96
|
56
|
Threading
|
|
BMR4405
|
KH3
|
1.84
|
0.96
|
6
|
Fragment Assembly +
Homology Modeling
|
|
BMR4430
|
Calcyclin
|
3.72
|
2.44
|
84
|
Fragment Assembly +
Homology Modeling
|
|
BMR4554
|
Dihydrofolate Reductase
|
1.13
|
0.50
|
12
|
Threading
|
|
BMR4562
|
Lysozyme
|
0.84
|
0.27
|
9
|
Fragment Assembly +
Homology Modeling
|
|
BMR4577
|
Ribosomal Protein S4 delta 41
|
2.35
|
1.42
|
22
|
Fragment Assembly +
Homology Modeling
|
|
BMR4675
|
Foxo4
|
3.58
|
2.61
|
27
|
Fragment Assembly +
Homology Modeling
|
|
BMR4840
|
Mycobacterium tuberculosis adenylate kinase
|
2.32
|
1.38
|
87
|
Fragment Assembly +
Homology Modeling
|
|
BMR4964
|
Barnase
|
0.73
|
0.31
|
9
|
Fragment Assembly +
Homology Modeling
|
|
BMR4968
|
Bovine Pancreatic Trypsin Inhibitor
|
1.05
|
0.29
|
4
|
Fragment Assembly +
Homology Modeling
|
|
BMR4974
|
CI-2 from Barley Seeds
|
0.99
|
0.15
|
5
|
Fragment Assembly +
Homology Modeling
|
|
BMR5220
|
Melanoma Inhibitory Activity Protein
|
2.74
|
1.27
|
9
|
Fragment Assembly +
Homology Modeling
|
|
BMR5316
|
HIV-1 Gag
|
1.95
|
1.31
|
21
|
Fragment Assembly +
Homology Modeling
|
|
BMR5387
|
Ubiquitin
|
2.37
|
1.03
|
6
|
Fragment Assembly +
Homology Modeling
|
|
BMR547
|
Calmodulin
|
3.24
|
2.81
|
13
|
Fragment Assembly +
Homology Modeling
|
|
BMR5473
|
Ovomucoid Third Domain
|
1.41
|
0.64
|
4
|
Fragment Assembly +
Homology Modeling
|
|
BMR5690
|
Cobra Neurotoxin II
|
1.60
|
0.89
|
5
|
Fragment Assembly +
Homology Modeling
|
|
BMR5899
|
Spo0f protein
|
2.58
|
1.88
|
9
|
Fragment Assembly +
Homology Modeling
|
|
BMR6338
|
At1G77540
|
---
|
---
|
---
|
De Novo (did not converge)
|
|
BMR6357
|
Beta Lactamase
|
1.25
|
0.28
|
25
|
Fragment Assembly +
Homology Modeling
|
|
BMR6367
|
YhgG
|
---
|
---
|
---
|
De Novo (did not converge)
|
|
BMR6410
|
Glutaredoxin 1
|
3.13
|
2.21
|
44
|
Threading
|
|
BMR6444
|
MMP12
|
1.55
|
0.64
|
13
|
Fragment Assembly +
Homology Modeling
|
|
BMR6699
|
Calbindin D9K
|
3.02
|
1.92
|
5
|
Fragment Assembly +
Homology Modeling
|
|
BMR6821
|
Superoxide dismutase
|
1.75
|
1.28
|
13
|
Fragment Assembly +
Homology Modeling
|
|
BMR6922
|
Vts1 SAM domain
|
2.16
|
1.16
|
7
|
Fragment Assembly +
Homology Modeling
|
|
|
|
|
|
|
|
|
Average
|
|
1.95
|
1.11
|
10 (median)
|
|
Table 4.
Backbone RMSD between CS23D2.0 models and corresponding experimental structures for recent entries in BMRB database (as of the first week of April 2008).
| Protein name |
PDB ID |
BMRB ID |
RMSDbb (Å) |
Method |
| TnpE |
2RN7A |
15701 |
Did not converge |
De Novo |
| Chromo domain of chromobox |
2K28A |
15695 |
1.34 |
Fragment Assembly + Homology modeling |
| SeR13 |
2K1HA |
15678 |
2.31 |
Fragment Assembly + Homology modeling |
| Chromo domain of the Chromobox |
2K1BA |
15674 |
1.22 |
Fragment Assembly + Homology modeling |
| EwR120 |
2JZAA |
15611 |
1.72 |
Fragment Assembly + Homology modeling |
| SgR42 |
2JZ2A |
15604 |
4.88 |
Threading |
| ER541-37-162 |
2K1G |
15603 |
Did not converge |
Threading |
| alpha-RgIA |
1CNL |
15586 |
1.69 |
Fragment Assembly + Homology modeling |
| Ig domain of human palladin |
2DM2A |
15512 |
1.29 |
Threading |
| Human NEMO zinc finger |
2JT3A |
15499 |
1.81 |
Fragment Assembly + Homology modeling |
| NEMO zinc finger |
2JVXA |
15499 |
2.85 |
Fragment Assembly + Homology modeling |
| Abl kinase |
2HYYA |
15488 |
1.76 |
Fragment Assembly + Homology modeling |
| YmoA |
2JVPA |
15486 |
2.15 |
Fragment Assembly + Homology modeling |
| alpha-RgIA |
1CNL |
15436 |
1.69 |
Fragment Assembly + Homology modeling |
| alpha-RgIA |
1CNL |
15435 |
1.69 |
Fragment Assembly + Homology modeling |
| apo-LFABP |
2JU3A |
15429 |
2.32 |
Fragment Assembly + Homology modeling |
| Human Ubiquitin |
1UBQ |
15410 |
1.05 |
Fragment Assembly + Homology modeling |
| RGD-hirudin |
2JOOA |
15405 |
1.32 |
Fragment Assembly + Homology modeling |
| MMP-3 |
2JT6 |
15396 |
1.21 |
Fragment Assembly + Homology modeling |
| MMP-3 |
2JT5A |
15395 |
1.17 |
Fragment Assembly + Homology modeling |
| F153W cardiac troponin C |
2JT3A |
15388 |
3.68 |
Fragment Assembly + Homology modeling |
| Four-Alpha-Helix Bundle |
2I7UA |
15384 |
1.48 |
Threading |
| Huwentoxin-XI |
2JOTA |
15382 |
1.51 |
Fragment Assembly + Homology modeling |
| VraR DNA Binding Domain |
2RNJA |
15378 |
0.93 |
Fragment Assembly + Homology modeling |
| Human DESR1 |
2JR7A |
15377 |
1.81 |
Fragment Assembly + Homology modelling |
| Cys2His2 zinc finger |
2JSPA |
15373 |
Did not converge |
De Novo |
| alpha-RgIA |
1CNL |
15368 |
1.69 |
Fragment Assembly + Homology modeling |
| alpha-RgIA |
1CNL |
15367 |
1.69 |
Fragment Assembly + Homology modeling |
| MMP20 |
2JSDA |
15361 |
1.14 |
Fragment Assembly + Homology modeling |
| MEKK3 PB1 domain |
2PPHA |
15355 |
1.24 |
Fragment Assembly + Homology modeling |
| 1st SH3 domain of adaptor Nck |
2JS2A |
15351 |
1.57 |
Fragment Assembly + Homology modeling |
| 2nd SH3 domain of adaptor Nck |
2JS0A |
15349 |
2.05 |
Fragment Assembly + Homology modeling |
| Manduca sexta moricin |
2JR8A |
15323 |
2.66 |
Fragment Assembly + Homology modeling |
| CheW |
2HO9A |
15322 |
2.66 |
Threading |
| Discoidin Domain of DDR2 |
2Z4FA |
15315 |
1.63 |
Threading |
| NusB from Aquifex Aeolicus |
2JR0 |
15312 |
3.91 |
Threading |
| C2 domain of human Smurf2 |
2JQZA |
15306 |
Did not converge |
Threading |
| CTX A3 |
1I02A |
15305 |
2.20 |
Fragment Assembly + Homology modeling |
| Cu(I) human Sco2 |
2RLIA |
11001 |
2.19 |
Fragment Assembly + Homology modeling |
Table 5. Backbone RMSDs between models generated by CS23D2.0 sub-program for ab initio folding and corresponding
experimental structures.
| Protein |
PDB ID |
RMSDbb (Å) |
| HIS15ASP |
1CM2 |
0.98 |
| TM1442 |
1SBO |
2.56 |
| XcR50 |
1TTZ |
1.31 |
| CSPA |
1MJC |
2.77 |
| Ubiquitin |
1UBQ |
2.5 |
| Apo-lfabp |
1LFO |
1.68 |
| DNA Polymerase |
1DK3 |
2.71 |
| OMTKY3 |
1OMT |
1.83 |
| BPTI |
5PTI |
1.94 |
| Calbindin D9k |
1IG5 |
3.1 |
Rosetta 2.2.0 was used to provide CS23D2.0 with ab initio folding functionality
Table 6: Ubiquitin models built with CS23D2.0 using (a) homology modelling, (b) threading, and (c) ab initio folding. RMSDs and sequence identity
values were calculated with respect to the native structure (1UBQ). Tables (a) and (b) show the ubiquitin models built
as ubiquitin homologs were progressively removed from the database, so that the homolog used
in a given row is the best one found by CS23D2.0 when the more closely matching homologs above it
were removed.
(c) Results of ab initio folding of ubiquitin by Rosetta.
50 models were produced in each of 10 runs. Backbone RMSDs of the model with the best CS23D2.0 score are shown,
with those less than 2.8 Å labeled as successes.
Homologous proteins were excluded from Rosetta's fragment generation step.
(a) Homology Modelling
| Template |
RMSD (Å) |
Sequence Identity (%) |
| All atoms |
C-alpha |
| 1UBQA |
0.00 |
0.00 |
100.00 |
| 1UD7A |
2.18 |
0.85 |
90.79 |
| 1C3TA |
2.09 |
0.60 |
89.47 |
| 1SIFA |
1.35 |
0.41 |
90.14 |
| 1BT0A |
1.55 |
0.52 |
61.64 |
| 1NDDA |
1.43 |
0.49 |
56.76 |
| 2DZIA |
2.43 |
0.93 |
39.47 |
| 2JWZA |
2.01 |
1.00 |
94.74 |
| 2BKRB |
1.96 |
0.50 |
57.89 |
| 2NVUJ |
2.03 |
1.07 |
57.89 |
(b) Threading
| Template |
RMSD (Å) |
Sequence Identity (%) |
| All atoms |
C-alpha |
| 1UELA |
1.99 |
0.79 |
31.58 |
| 1MG8A |
2.43 |
1.41 |
31.58 |
| 1IYFA |
3.17 |
1.99 |
30.26 |
| 1WY8A |
4.47 |
4.16 |
39.47 |
| 1WX9A |
2.52 |
1.16 |
34.21 |
| 2BWFA |
4.36 |
3.98 |
32.89 |
| 1OQYA |
3.68 |
2.49 |
35.53 |
| 2HJ8A |
2.73 |
1.84 |
32.00 |
| 1WE7A |
4.85 |
4.16 |
27.63 |
| 2FAZA |
5.20 |
4.83 |
36.84 |
| 1WH3A |
2.14 |
0.86 |
35.53 |
| 1Z2MA |
2.30 |
0.96 |
32.89 |
| 1TTNA |
2.76 |
1.60 |
26.32 |
| 1M94A |
2.12 |
0.97 |
23.29 |
(c) Ab initio
| Run |
Lowest Score Backbone RMSD (Å) |
Results |
| 1 |
2.80 |
FAILED |
| 2 |
4.39 |
FAILED |
| 3 |
3.36 |
FAILED |
| 4 |
2.92 |
FAILED |
| 5 |
5.26 |
FAILED |
| 6 |
3.99 |
FAILED |
| 7 |
2.72 |
SUCCESS |
| 8 |
2.55 |
SUCCESS |
| 9 |
2.82 |
FAILED |
| 10 |
2.78 |
SUCCESS |
Table 7. Comparison of model global accuracy achieved by CS23D2.0 and similar programs.
(a). Comparison of backbone RMSDs of models generated by CS-ROSETTA, CHESHIRE, and CS23D2.0.
| Protein Name |
PDB ID |
BMRB ID |
CS-ROSETTA RMSDbb (Å) |
CHESHIRE RMSDbb (Å) |
CS23D2.0 RMSDbb (Å) |
| TM1442 |
1SBO |
5921 |
1.22 |
1.32 |
1.84 |
| Calbindin |
4ICB |
390 |
1.39 |
1.47 |
2.41 |
| Hpr |
1HDN |
2371 |
1.99 |
1.83 |
0.96 |
| Ubiquitin |
1UBQA |
5387 |
0.82 |
1.33 |
1.34 |
| FF domain |
2UCZ |
6711 |
|
1.46 |
1.12 |
| HR2106 |
2HZ5 |
6210 |
1.85 |
|
2.13 |
| Spo0F |
1SRR |
5899 |
1.67 |
|
1.88 |
| Apo 1fabp |
1LFO |
4098 |
1.72 |
|
2.11 |
| CspA |
1MJC |
4296 |
1.43 |
|
0.75 |
| XcR50 |
1TTZ |
6363 |
1.67 |
|
2.41 |
| Profilin |
1PFL |
4082 |
2.26 |
|
1.8 |
| GB3 |
2OED |
15283 |
0.74 |
|
0.98 |
(b) Comparison of backbone RMSDs of models generated by CS-ROSETTA and CS23D2.0 for proteins that did not meet CS-ROSETTA convergence criteria.
| Protein Name |
PDB ID |
BMRB ID |
CS-Rosetta RMSDbb (Å) |
CS23D2.0 RMSDbb (Å) |
| HI0719 |
1J7H |
5606 |
14.31 |
1.02 |
| MTH1598 |
1JW3 |
5165 |
12.17 |
Did not converge |
| HR1958 |
1TVG |
6344 |
16.29 |
Did not converge |
| CcR19 |
1T17 |
6120 |
7.09 |
4.17 |
| YwIE |
1ZGG |
6460 |
9.37 |
1.37 |
| Flua |
1N0S |
5756 |
15.57 |
1.45 |
| nsp1 |
2GDT |
7014 |
5.6 |
Did not converge |
(c) Comparison of backbone RMSDs of models generated by CS-ROSETTA and CS23D2.0 for structural genomics proteins.
| Protein Name |
PDB ID |
BMRB ID |
CS-Rosetta RMSDbb (Å) |
CS23D2.0 RMSDbb (Å) |
| RpT7 |
2JTV |
15419 |
0.64 |
3.79 |
| StR82 |
2JT1 |
15386 |
0.57 |
3.45 |
| RhR95 |
2JVM |
15341 |
0.66 |
2.77 |
| TR80 |
2JXT |
15573 |
1.27 |
Did not converge |
| VfR117 |
2JVW |
15491 |
0.6 |
6.79 |
| PsR211 |
2JVA |
15471 |
2.07 |
3.49 |
Figure 1. Dependence of backbone RMSD of CS23D2.0 models on template sequence identity for different methods of structure generation
A scatter plot showing the performance of CS23D2.0´s three approaches to structure
generation (subfragment assembly + homology modeling, chemical shift threading and ab
initio structure generation) relative to the level of sequence identity of the matching
templates or subfragments. Data from Tables 3-6 in the CS23D2.0 web documentation pages was
used to assemble this graph.
Energy Function
Summary
CS23D2.0 uses an energy function consisting of several statistics-based pseudo-potentials:
Chemical shift correlation scores for HA, HN, N, CA, CB, and CO chemical shifts.
Chemical shifts for the CS23D2.0 models are predicted using SHIFTX, and,
after subtraction of random coil shifts for CA and CB shifts, correlation
coeffecients are determined between these predicted chemical shifts and the experimental
chemical shifts submitted by the user.
A threading potential.
Bump score for backbone atoms plus C-Beta and C-Gamma atoms.
Hydrogen bond count.
Ramachandran score counting phi and psi torsion angle violations.
Omega score counting omega angle violations.
Chi score based on expected chi angles for different phi and psi combinations.
Radius of gyration, giving a penalty if the calculated radius of gyration
deviates from the expected value by more than 10%.
Hydrogen bond energy.
Disulphide bond count.
Secondary structure score, based on the similarity between the secondary structure
of the CS23D2.0 3-D model and the expected secondary structure. The expected secondary
structure is normally based on that predicted by a sequence homology match to the PPT-DB 2º Structure (Cytoplasmic)
database.
If, however, this predicted secondary structure is more than 50% different from the
secondary structure predicted from the chemical shifts by CSI,
the CSI-predicted secondary structure is used as the expected secondary structure.
Score Weighting
Each of the initial terms in the energy function are transformed through a series of steps: (1)
They are multiplied so that they behave as energy-like terms,
i.e. more negative scores indicate a better structure. (2) They are scaled so that they all have
close to the same order of magnitude (about ± 1 to 100). (3) All scores except for the
chemical shifts scores and the radius of gyration score are normalized by dividing by the number
of residues in the peptide, and then multiplying by 100 to re-scale them. (4) All scores are
multiplied by weights that were determined based on training of the energy function on CASP7 decoys and decoys generated by Rosetta.
The initial score calculations, plus the results of steps (1) and (2) are:
Each of the Chemical shift correlation values (0.0 to 1.0) is multiplied by -10.0.
The threading potential is multiplied by 0.2.
In the initial bump score, for all pairs of atoms that are closer than the
allowed threshold distances, the magnitude of the difference between the observed distance
and the threshold, in Angstroms, is added to the score. Any distances closer than 70% of
the threshold receive an additional penalty of +10. The initial bump score is multiplied
by 0.5.
The hydrogen bond count (the number of hydrogen bonds) is multiplied by -1.1.
The initial Ramachandran score is calculated based on Ramachandran tables with four
angle classes: 3 (good), 2 (acceptable), 1 (minimal), 0 (disallowed). For each residue,
this class number r is used to generate a Rama score value of (3 - r)²,
and the sum of all these values over all residues is calculated. To the final score is then
added the fraction of residues that did not have an r value of 3.
For the omega score, if an omega angle is not within ±12.5° of 180°
or within ±15° of 0°, then the magnitude of the difference between the
omega angle and these thresholds is added to the omega score.
The chi score is based on the fact that chi angles cluster into three main groups
for each residue. Each chi angle is assigned to the chi group to which it is closest, and
the probability of observing that chi group given the phi and psi angles of the residue is
subtracted from the chi score.
For the radius of gyration score, if the calculated radius of gyration is not
within 10% of the expected radius of gyration, the magnitude of the difference between
the real and expected values is used as the intial radius of gyration score. The initial
score is multiplied by 2.5.
For the hydrogen bond energy score, the sum of all the hydrogen bond energies is
calculated. The sum is divided by the number of residues and multiplied by 40.0.
The disulphide bond count is multiplied by -3.0.
For the secondary structure score, the sum of all secondary structure mismatch
scores in the peptide is calculated: +4 for Beta-strand or helix matched with coil, and
+8 for Beta-strand residues matched with helix residues.
The weightings for step (4) for the above scores, other than the chemical shift scores, were
trained on decoys from CASP7 using linear regression-based fitting. The weights for the chemical shift scores were trained
separately on Rosetta decoys of structures with known chemical shifts; both ab-initio Rosetta
decoys and Rosetta decoys generated from relaxing the native structures. The relative weighting
between the chemical shift scores and the other scores was then determined based on linear
regression. The weights in step (4) are multiplied by the values in step (3) to obtain the
final scores. The step (4) weights are:
| Score name |
Score weight |
| HA |
1.22 |
| HN |
0.99 |
| N |
0.71 |
| CA |
0.62 |
| CB |
1.00 |
| CO |
0.41 |
| Thread |
0.46 |
| Bump |
0.07 |
| Hcount |
0.05 |
| Rama |
0.05 |
| Omega |
† 0.02 |
| Chi |
† 0.02 |
| RadGyr |
0.57 |
| HBenergy |
0.15 |
| Disulph |
0.55 |
| SecStr |
0.23 |
† Adjusted manually to a low value because training set it to 0.
CS23D2.0 Results Assessment
A CS23D2.0 results summary for a structure prediction includes the mean chemical shift
correlation values before and after energy minimization. The reliability of the final
structure is guaged by looking at the final mean chemical shift correlation:
   0.75 - 1.00 = High
   0.65 - 0.75 = Good
   0.55 - 0.65 = Moderate
   0.00 - 0.55 = Poor
A CS23D2.0 results summary also prints information on torsion angle violations. The
expected number of torsion angles in the core, allowed, generous and disallowed regions
is estimated based on the following percentages:
   #res in phi/psi core          90%
   #res in phi/psi allowed        7%
   #res in phi/psi generous       1%
   #res in phi/psi disallowed     0%
   #res in omega allowed         99%
   #res in omega disallowed       1%
Note: The first and last residues are not use for phi/psi, and the last residue is not
used for omega.
Torsion Angle Mapping for Thrifty
CS23D2.0 performs a homolog search based torsion similarity against a non-redundant database of
all cytoplasmic proteins in the PDB. This search uses an updated version of Thrifty that assigns
each residue a letter based on its torsion angle class. The torsion angle mappings for each of
the 9 letters in this torsion angle alphabet are shown below.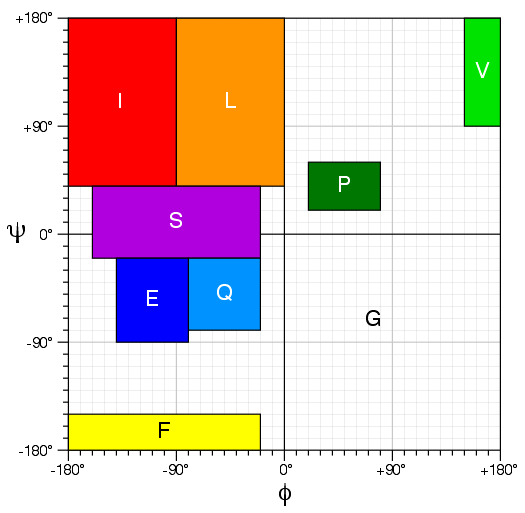
|